Advertisements
Advertisements
प्रश्न
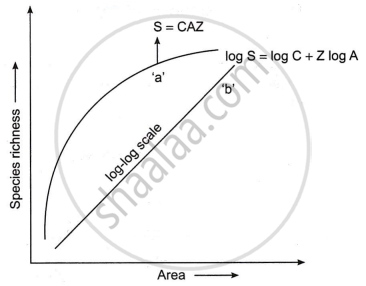
Explain the species-area relationship using the graphical representation given below:
or
The following graph shows the species-area relationship. Answer the following questions as directed.
- Name the naturalist who studied the kind of relationship shown in the graph. Write the observations made by him.
- Write the situations as discovered by the ecologists when the value of ‘Z’ (slope of the line) lies between:
- 0.1 and 0.2
- 0.6 and 1.2
What does ‘Z’ stand for?
- When would the slope of the line ‘b’ become steeper?
Advertisements
उत्तर
(a) Alexander von Humboldt noted that species richness within a region grew with increased exploration, but only up to a certain point. The relationship between species richness and area for several taxa, including angiospermic plants, birds, bats, and fishes, follows a rectangular hyperbola pattern. On a logarithmic scale, the relationship is a straight line represented by the equation.
log S = log C + Z log A
where, S = species richness
A = area
z = slope of the line (regression coefficient)
C = Y-intercept
(b) (i) Ecologists found that Z values vary from 0.1 to 0.2, regardless of taxonomic group or region, while exploring a restricted region.
(ii) When analyzing species-area relationships over huge areas, such as continents, the slope of the line is significantly steeper (Z values ranging from 0.6-1.2).
‘Z’ stands for the regression coefficient (slope of the line).
(c) The slope of the line ‘b’ will become steeper when the explored area is increasing.
