Advertisements
Advertisements
प्रश्न
Explain the following diagram.
थोडक्यात उत्तर
आकृती
Advertisements
उत्तर
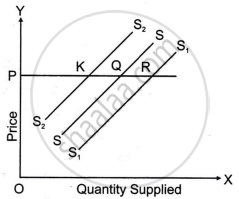
The diagram relates to the concept of change in supply.
- SS curve is the original supply curve.
- When supply increases, the supply curve shifts to the right. It is denoted by S1S1 curve. At OP price, supply increases from PQ to PR.
- Supply curve S2S2 indicates the situation of a decrease in supply. The producer is now willing to supply less quantity, i.e., PK, at the same price.
shaalaa.com
या प्रश्नात किंवा उत्तरात काही त्रुटी आहे का?
पाठ 3: Theory of Supply - QUESTION BANK [पृष्ठ ८३]
