Advertisements
Advertisements
प्रश्न
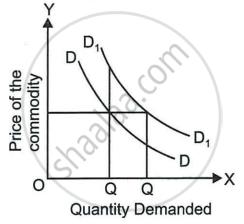
Explain the following diagram:
Advertisements
उत्तर
The diagram above shows a change in the demand curve to the left. From the demand curve D1D1 to DD, a decline in quantity is caused by a change in market conditions rather than a change in its own price. At the same price P, demand was initially Q1 quantity but eventually decreased to Q.
APPEARS IN
संबंधित प्रश्न
If Coke and Fanta are close substitutes to each other, a rise in price of Coke will lead to ______ for Fanta.
As a result of rise in consumer's income, the demand curve for coarse-grain (inferior good) will:
With the help of a graph explain the increase in demand concept.
What does a downward movement along the same demand curve indicate?
What does an upward movement along the same demand curve indicate?
What is an expansion of demand?
With the help of a suitable diagram, distinguish between a change in quantity demanded and a change in demand.
Distinguish between “movement along the demand curve” and shift of a demand curve.
What causes a downward movement along a demand curve?
Explain the following diagram.

