Advertisements
Advertisements
प्रश्न
Explain graphically the following:
Unitary Elastic Supply
स्पष्ट करा
Advertisements
उत्तर
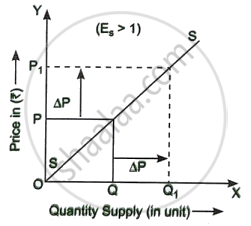
The given graph shows unitary elastic supply (Es = 1), where the percentage change in price is exactly equal to the percentage change in quantity supplied. The supply curve (SS) is a straight upward-sloping line, indicating a constant relationship between price and quantity supplied.
In the graph, when price rises from P to P1, the quantity supplied increases proportionately from Q to Q1, showing that producers adjust supply in direct proportion to price changes.
shaalaa.com
या प्रश्नात किंवा उत्तरात काही त्रुटी आहे का?
पाठ 3: Theory of Supply - QUESTIONS [पृष्ठ ८०]
