Advertisements
Advertisements
प्रश्न
Estimate the median, the lower quartile and the upper quartile of the following frequency distribution by drawing an ogive:
| Age( in yrs) | Under 10 | Under 20 | Under 30 | Under 40 | Under 50 | Under 60 |
| No. of males | 6 | 10 | 25 | 32 | 43 | 50 |
Advertisements
उत्तर
Given data is cumulative data , so draw the ogive as it is .
| Age (in yrs) Under | No. of males (f) |
| 10 | 6 |
| 20 | 10 |
| 30 | 25 |
| 40 | 32 |
| 50 | 43 |
| 60 | 50 |
Take a graph paper and draw both the axes.
On the x-axis , take a scale of 1cm = 10 to represent the Age (in yrs) under.
On the y-axis , take a scale of 1cm = 10 to represent the no. of males.
Now , plot the points (10,6) , (20,10) , (30,25) ,(40,32) , (50,43) ,(60,5).
Join them by a smooth curve to get the ogive.
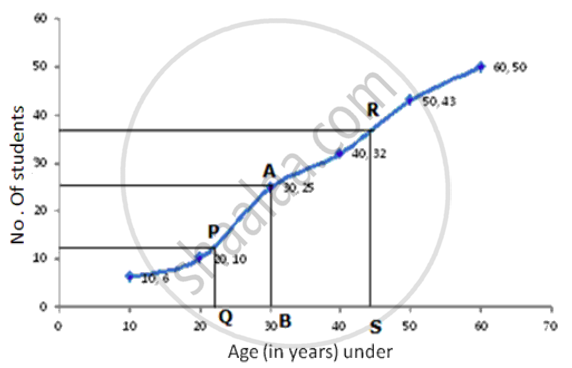
No. of terms = 50
∴ Median = `(25+26)/2` = 25.5th term
Through mark of 25.5 on y-axis draw a line parallel to x-axis which meets the curve at A. From A, draw a perpendicular to x-axis which meets it at B.
The value of B is the median which is 30.
Lower Quartile (Q1) = `n/4 = 50/4` = 12.5th term
Through mark of 12.5 on y-axis draw a line parallel to x-axis which meets the curve at P. From a perpendicular to x-axis which meets it at Q.
The value of Q is the lower quartile which is 22.
Upper Quartile (Q3) = `(n xx 3)/4 = (50 xx 3)/4` = 37.5th term
Through mark of 37.5 on y-axis draw a line parallel to x-axis which meets the curve at R. From R, draw a perpendicular to x-axis which meets it at S.
The value of S is the upper quartile which is 44.
