Advertisements
Advertisements
प्रश्न
Draw the graph of the following line:
x = 2
आलेख
Advertisements
उत्तर
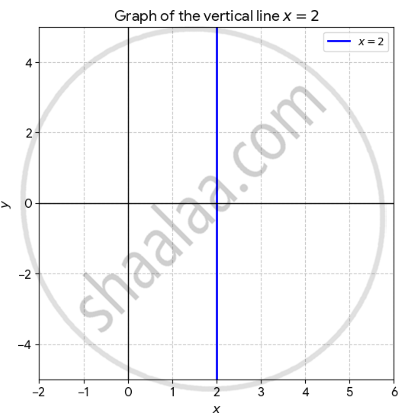
The graph of the equation x = 2 is a vertical line that passes through the point (2, 0) on the x-axis.
Analysis of the line
Constant x-value: For any point on this line, the x-coordinate is always 2, regardless of the y-value e.g., (2. –5), (2, 0), (2, 10).
Slope: The slope (m) of a vertical line is undefined because the “run” (change in x) is zero and division by zero is not possible in the slope formula `m = (Δy)/(Δx)`.
Intercepts: The line has an x-intercept at (2, 0) and has no y-intercept unless the line itself is x = 0.
Orientation: It is perfectly parallel to the y-axis.
shaalaa.com
या प्रश्नात किंवा उत्तरात काही त्रुटी आहे का?
