Advertisements
Advertisements
प्रश्न
Draw the graph of the following equation:
y = 2x
Advertisements
उत्तर
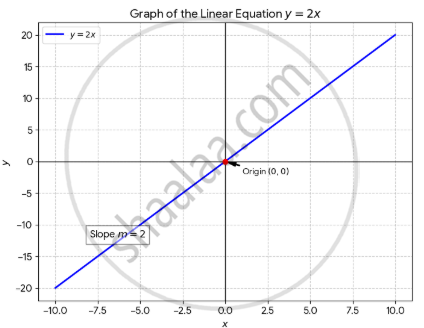
The graph of the equation y = 2x is a straight line passing through the origin.
Characteristics of the graph
1. Linear form: This is a linear equation in the slope-intercept form y = mx + b, where the slope m = 2 and the y-intercept b = 0.
2. The slope (m = 2): The slope represents the “steepness” of the line. For every 1 unit move to the right along the x-axis, the line rises 2 units along the y-axis. This positive slope indicates that the function is strictly increasing.
3. The intercepts:
1. Y-Intercept: Since b = 0, the line crosses the y-axis at (0, 0).
2. X-Intercept: Setting y = 0 gives 0 = 2x, meaning the line also crosses the x-axis at the origin (0, 0).
4. Points on the line: By substituting values for x, we can find corresponding points to plot the line:
1. If x = 1
y = 2(1)
y = 2
⇒ (1, 2)
2. If x = –1
y = 2(–1)
y = –2
⇒ (–1, –2)
3. If x = 3
y = 2(3)
y = 6
⇒ (3, 6)
