Advertisements
Advertisements
प्रश्न
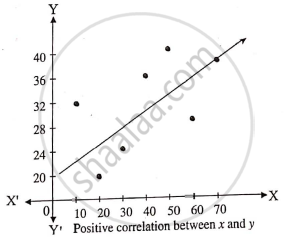
Draw scatter diagram for the following data and interpret it :
| x | 10 | 20 | 30 | 40 | 50 | 60 | 70 |
| y | 32 | 20 | 24 | 36 | 40 | 28 | 38 |
बेरीज
Advertisements
उत्तर
shaalaa.com
या प्रश्नात किंवा उत्तरात काही त्रुटी आहे का?
2015-2016 (March)
