Advertisements
Advertisements
प्रश्न
Draw a histogram for the following distribution and estimate the mode:
| Mangoes | 0-9 | 10-19 | 20-29 | 30-39 | 40-49 | 50-59 |
| No. of trees | 10 | 16 | 20 | 14 | 6 | 4 |
तक्ता
बेरीज
Advertisements
उत्तर
| Mangoes per tree | No. of trees |
| 0.5-9.5 | 10 |
| 9.5-19.5 | 16 |
| 19.5-29.5 | 20 |
| 29.5-39.5 | 14 |
| 39.5-49.5 | 6 |
| 49.5-59.5 | 4 |
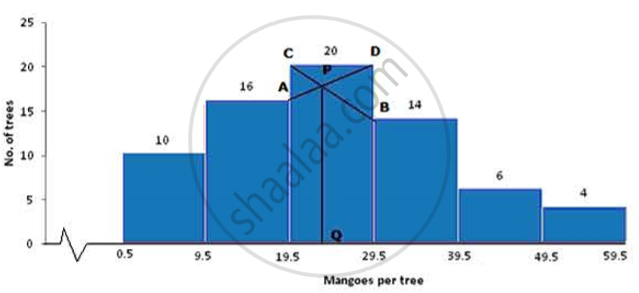
(a) Take 1cm = 1 unit and plot mangoes on x-axis and no. of trees on y-axis.
(b) Draw a bar graph for the given data.
(c) From the histogram it is clear that class 19.5-29.5 has highest frequency i.e. 20
(d) Join the ends of the corresponding frequencies which meet at P and drop a perpendicular on the x-axis from P to Q. Q is the mode.
Therefore, Mode = 23 .5
shaalaa.com
या प्रश्नात किंवा उत्तरात काही त्रुटी आहे का?
