Advertisements
Advertisements
प्रश्न
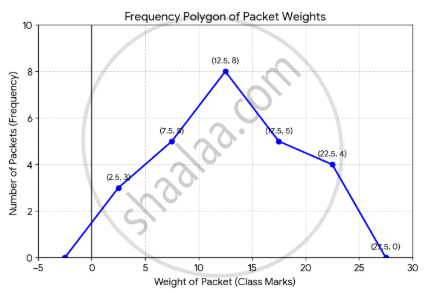
Draw frequency polygon of the following distribution.
| Weight of packet | 0 – 5 | 5 – 10 | 10 – 15 | 15 – 20 | 20 – 25 |
| Number of packets | 3 | 5 | 8 | 5 | 4 |
आलेख
बेरीज
Advertisements
उत्तर
1. Class mark calculation table
| Weight of Packet (Class Interval) |
Class Mark (x-axis) |
Number of Packets (Frequency, y-axis) |
Plotting Point (x, y) |
| –5 – 0 (Imaginary) | –2.5 | 0 | (–2.5, 0) |
| 0 – 5 | 2.5 | 3 | (2.5, 3) |
| 5 – 10 | 7.5 | 5 | (7.5, 5) |
| 10 – 15 | 12.5 | 8 | (12.5, 8) |
| 15 – 20 | 17.5 | 5 | (17.5, 5) |
| 20 – 25 | 22.5 | 4 | (22.5, 4) |
| 25 – 30 (Imaginary) | 27.5 | 0 | (27.5, 0) |
2. Frequency polygon graph
3. Steps to draw it on graph paper
Axes Setup: Plot weight of packet on the horizontal x-axis and number of packets on the vertical y-axis.
Plot Points: Mark the coordinates (x, y) from the table above as dots on your graph paper.
Connect Points: Use a straight ruler to join the consecutive dots one by one.
shaalaa.com
या प्रश्नात किंवा उत्तरात काही त्रुटी आहे का?
