Advertisements
Advertisements
प्रश्न
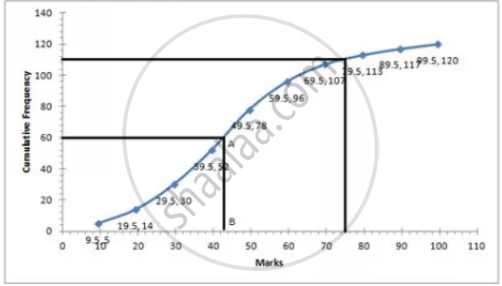
Draw an ogive for the data given below and from the graph determine:
- the median marks
- the number of students who obtained more than 75% marks
| Marks | No. of students |
| 0 – 9 | 5 |
| 10 – 19 | 9 |
| 20 – 29 | 16 |
| 30 – 39 | 22 |
| 40 – 49 | 26 |
| 50 – 59 | 18 |
| 60 – 69 | 11 |
| 70 – 79 | 6 |
| 80 – 89 | 4 |
| 90 – 99 | 3 |
आलेख
Advertisements
उत्तर
| Marks | No. of students | Cumulative frequency |
| 0.5 – 9.5 | 5 | 5 |
| 9.5 – 19.5 | 9 | 14 |
| 19.5 – 29.5 | 16 | 30 |
| 29.5 – 39.5 | 22 | 52 |
| 39.5 – 49.5 | 26 | 78 |
| 49.5 – 59.5 | 18 | 96 |
| 59.5 – 69.5 | 11 | 107 |
| 69.5 – 79.5 | 6 | 113 |
| 79.5 – 89.5 | 4 | 117 |
| 89.5 – 99.5 | 3 | 120 |
Total number of terms = 120
 i. i. ∴ Median = `120/2` = 60th term
Through mark 60, draw a parallel line to x-axis which meets the curve at A. From A, draw a perpendicular to x-axis meeting it at B.
The value of point B is the median = 43
ii. Total marks = 100
75% of total marks = `75/100 xx 100 = 75`
The number of students getting more than 75% marks = 120 – 111 = 9
shaalaa.com
या प्रश्नात किंवा उत्तरात काही त्रुटी आहे का?
