Advertisements
Advertisements
प्रश्न
Draw a histogram for the following frequency distribution and find the mode from the graph.
| Class | 0 – 5 | 5 – 10 | 10 – 15 | 15 – 20 | 20 – 25 | 25 – 30 |
| Frequency | 2 | 5 | 18 | 14 | 8 | 5 |
आलेख
Advertisements
उत्तर
Steps:
- Take 1 cm along x-axis = 5 units and 1 cm along y-axis = 4 units.
- Construct rectangles corresponding to the given data.
- In highest rectangle, draw two st. lines AC and BD from corners of the rectangles on either side of the highest rectangle to the opposite corners of the highest rectangle. Let P be the point of intersection of AC and BD.
- Through P, draw a vertical line to meet the x-axis at M. The abscissa of the point M represents 14.
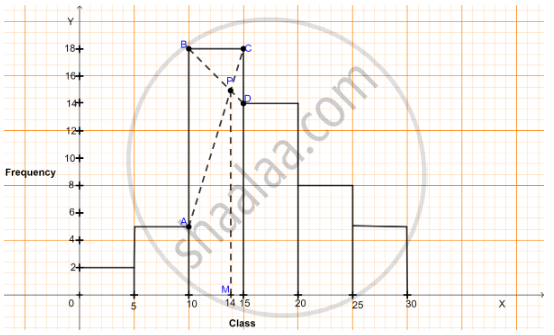
Hence, the required mode = 14.
shaalaa.com
या प्रश्नात किंवा उत्तरात काही त्रुटी आहे का?
