Advertisements
Advertisements
प्रश्न
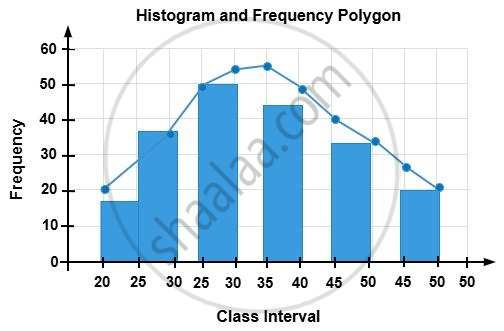
Draw a histogram and frequency polygon from the following data:
| Class interval | 20 – 25 | 25 – 30 | 30 – 35 | 35 – 40 | 40 – 45 | 45 – 50 |
| Frequencу | 24 | 30 | 52 | 46 | 28 | 10 |
आलेख
Advertisements
उत्तर
shaalaa.com
या प्रश्नात किंवा उत्तरात काही त्रुटी आहे का?
