Advertisements
Advertisements
प्रश्न
Draw a histogram and estimate the mode for the following frequency distribution:
| Class | 0 – 10 | 10 – 20 | 20 – 30 | 30 – 40 | 40 – 50 | 50 – 60 |
| Frequency | 2 | 8 | 10 | 5 | 4 | 3 |
आलेख
Advertisements
उत्तर
Draw a histogram
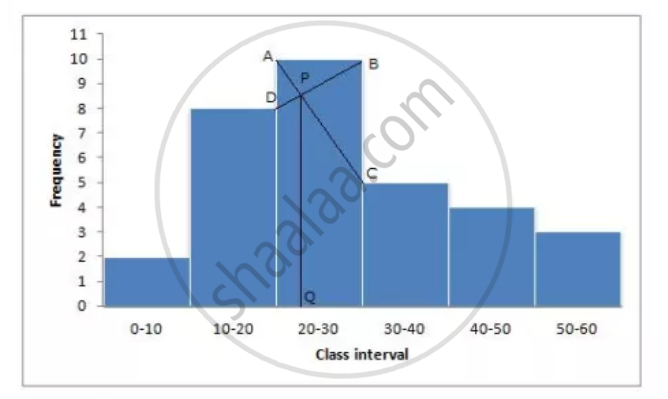
- In the highest rectangle which represents modal class draw two lines AC and BD intersecting at P.
- From P, draw a perpendicular to the x-axis meeting at Q.
- Value of Q is the mode = 23.
shaalaa.com
या प्रश्नात किंवा उत्तरात काही त्रुटी आहे का?
