Advertisements
Advertisements
प्रश्न
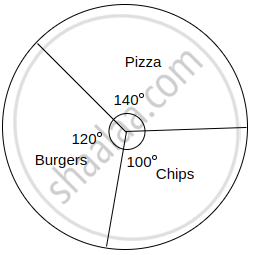
A survey was conducted for 180 people in a city. 70 ate Pizza, 60 ate burgers and 50 ate chips. Draw a pie diagram for the given information.
तक्ता
आकृती
Advertisements
उत्तर
Total number of people = 180
Converting the number of people who prefer various food items into components part of 360°
Central angle of a component = `"Value of the component"/"Total value" xx 360^circ`
| Items | No. of people | Central angle |
| Pizza | 70 | `70/180 xx 360^circ = 140^circ` |
| Burgers | 60 | `60/180 xx 360^circ = 120^circ` |
| Chips | 50 | `50/180 xx 360^circ = 100^circ` |
| Total | 180 | 360° |
Food items preferred by people:
shaalaa.com
या प्रश्नात किंवा उत्तरात काही त्रुटी आहे का?
