Advertisements
Advertisements
प्रश्न
40 students enter for a game of shot-put competition. The distance thrown (in metres) is recorded below:
| Distance (in m) | 12 – 13 | 13 – 14 | 14 – 15 | 15 – 16 | 16 – 17 | 17 – 18 | 18 – 19 |
| No. of students | 3 | 9 | 12 | 9 | 4 | 2 | 1 |
Use a graph paper to draw an ogive for the above distribution.
Use a scale of 2 cm = 1 m on one axis and 2 cm = 5 students on the other axis.
Hence, using your graph, find:
- the median.
- upper quartile.
- number of students who cover a distance which is above `16 1/2` m.
Advertisements
उत्तर
1. Construct the cumulative frequency table
To draw an ogive (cumulative frequency curve), we first calculate the cumulative frequency for each upper class boundary.
| Distance (m) |
No. of Students (f) |
Cumulative Frequency (cf) |
Points to Plot (x, y) |
| 12 – 13 | 3 | 3 | (13, 3) |
| 13 – 14 | 9 | 3 + 9 = 12 | (14, 12) |
| 14 – 15 | 12 | 12 + 12 = 24 | (15, 24) |
| 15 – 16 | 9 | 24 + 9 = 33 | (16, 33) |
| 16 – 17 | 4 | 33 + 4 = 37 | (17, 37) |
| 17 – 18 | 2 | 37 + 2 = 29 | (18, 39) |
| 18 – 19 | 1 | 39 + 1 = 40 | (19, 40) |
2. Draw the Ogive
Using the specified scales (2 cm = 1 m on the x-axis and 2 cm = 5 students on the y-axis), we plot the points and join them with a smooth curve starting from (12, 0).
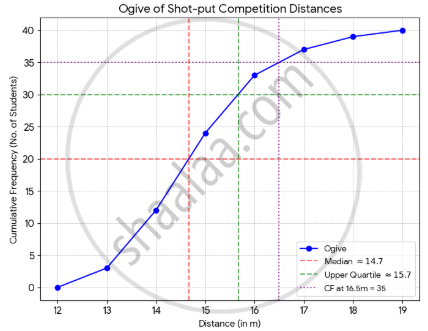
3. Find the median
The total number of students is N = 40.
The median corresponds to the `N/2`
= `40/2`
= 20th students.
Locate 20 on the y-axis.
Draw a horizontal line to the curve, then a vertical line down to the x-axis.
Median = 14.67 m (Accepted range: 14.6 – 14.8 m).
4. Find the upper quartile (Q3)
The upper quartile corresponds to the `(3N)/4`
= `(3 xx 40)/4`
= 30th student.
Locate 30 on the y-axis.
Draw a horizontal line to the curve, then a vertical line down to the x-axis.
Upper quartile = 15.67 m (Accepted range: 15.6 – 15.8 m).
5. Find students above `16 1/2` m
To find the number of students who covered more than 16.5 m:
Locate 16.5 m on the x-axis.
Draw a vertical line up to the curve, then a horizontal line to the y-axis.
This gives a cumulative frequency of 35 students those who threw ≤ 16.5 m.
Number of students above 16.5 m = Total students – 35
= 40 – 35
= 5 students.
Based on the ogive, the median is approximately 14.67 m, the upper quartile is approximately 15.67 m and there are 5 students who threw a distance above `16 1/2` m.
Notes
The answer in the textbook is incorrect.
