Please select a subject first
Advertisements
Advertisements
The sum of the three numbers is 132. If the first number be twice the second and third numbers be one-third of the first. then the second number is
Concept: undefined >> undefined
Which of the following numbers should be added to 11158 to make it exactly divisible by 77?
Concept: undefined >> undefined
Advertisements
A number divided by 56 gives 29 as the remainder. If the same number is divided by 8, the remainder will be
Concept: undefined >> undefined
LCM of 22, 54, 108, 135, 198 is
Concept: undefined >> undefined
The smallest number which when divided by 9, 12 and 16, leaves remainder 5 is
Concept: undefined >> undefined
If the numerator of a fraction is increased by 150% and the denominator of the fraction is increased by 350%, the resultant fraction is 25/51 . What is the original fraction?
Concept: undefined >> undefined
The sum of all the natural numbers from 200 to 600 (both inclusive) which are neither divisible by 8 nor by 12 is:
Concept: undefined >> undefined
Choose the most appropriate option:
What is the sum of all the natural numbers from 1 to 100?
Concept: undefined >> undefined
Directions: Examine the following expressions/activities/processes, and arrange them in the most logical sequence
1. Design, 2. Need, 3. Launching, 4. Research, 5. Testing, 6. Identify
Concept: undefined >> undefined
Direction : Answer the question on the basis of the information given below.
The pie chart given below shows the percentage of print space allocation of articles printed on different sections of a newspaper.
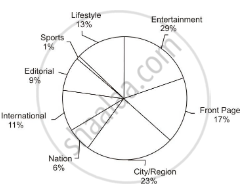
If the total number of words printed in the 'International' section was approximately 88770, then which of the following is the closest approximation of the total number of words printed in the 'Lifestyle' section?
Concept: undefined >> undefined
Direction: Answer the question on the basis of the information given below.
The pie chart given below shows the percentage of print space allocation of articles printed on different sections of a newspaper.
What percentage of the total space allocation has been earmarked for 'City/ Region', 'Nation' and 'International' news cumulatively?
Concept: undefined >> undefined
Direction: Answer the question on the basis of the information given below.
The pie chart given below shows the percentage of print space allocation of articles printed on different sections of a newspaper.
If the entire space allocated to 'Entertainment' is split equally between 'Sports' and 'Nation' and the total number of words in the Nation section is now 256000, then what would be the total number of words in the 'Sports' section?
Concept: undefined >> undefined
Direction: Answer the question on the basis of the information given below.
The pie chart given below shows the percentage of print space allocation of articles printed on different sections of a newspaper.
What percentage (approximately) more than the print space allocation for 'Editorial' in the print space allocation for 'Front Page'?
Concept: undefined >> undefined
Direction : Answer the question on the basis of the information given below.
The table given below shows information about the toys manufactured by 6 different companies. Each company manufactures only two types of toys – vehicles and dolls. Among toy vehicles each company manufactures Cars and Trucks only. The table shows the number of toy vehicles as a percentage of total toys manufactured by each company. It also shows the ratio of Cars and Trucks manufactured. Each company manufactured a total of 50000 toys in a year.
| Company | Toy vehicles | Cars : Trucks |
| R | 50 % | 1:4 |
| S | 70% | 3:1 |
| T | 40% | 1:1 |
| U | 30% | 1:2 |
| V | 60% | 2:3 |
| W | 40% | 2:1 |
What is the total number of toy cars manufactured by company T and S together?
Concept: undefined >> undefined
Direction: Answer the question on the basis of the information given below.
The table given below shows information about the toys manufactured by 6 different companies. Each company manufactures only two types of toys – vehicles and dolls. Among toy vehicles each company manufactures Cars and Trucks only. The table shows the number of toy vehicles as a percentage of total toys manufactured by each company. It also shows the ratio of Cars and Trucks manufactured. Each company manufactured a total of 50000 toys in a year.
| Company | Toy vehicles | Cars : Trucks |
| R | 50 % | 1:4 |
| S | 70% | 3:1 |
| T | 40% | 1:1 |
| U | 30% | 1:2 |
| V | 60% | 2:3 |
| W | 40% | 2:1 |
Which of the following options correctly represents the number of dolls, cars and trucks manufactured by company V?
Concept: undefined >> undefined
Direction: Answer the question on the basis of the information given below.
The table given below shows information about the toys manufactured by 6 different companies. Each company manufactures only two types of toys – vehicles and dolls. Among toy vehicles each company manufactures Cars and Trucks only. The table shows the number of toy vehicles as a percentage of total toys manufactured by each company. It also shows the ratio of Cars and Trucks manufactured. Each company manufactured a total of 50000 toys in a year.
| Company | Toy vehicles | Cars : Trucks |
| R | 50 % | 1:4 |
| S | 70% | 3:1 |
| T | 40% | 1:1 |
| U | 30% | 1:2 |
| V | 60% | 2:3 |
| W | 40% | 2:1 |
Which of the following options is the closest to the average number of dolls manufactured by these six companies mentioned above?
Concept: undefined >> undefined
Direction: Answer the question on the basis of the information given below.
The table given below shows information about the toys manufactured by 6 different companies. Each company manufactures only two types of toys – vehicles and dolls. Among toy vehicles each company manufactures Cars and Trucks only. The table shows the number of toy vehicles as a percentage of total toys manufactured by each company. It also shows the ratio of Cars and Trucks manufactured. Each company manufactured a total of 50000 toys in a year.
| Company | Toy vehicles | Cars : Trucks |
| R | 50 % | 1:4 |
| S | 70% | 3:1 |
| T | 40% | 1:1 |
| U | 30% | 1:2 |
| V | 60% | 2:3 |
| W | 40% | 2:1 |
What percentage of the total number of toys produced by company S is the total number of cars produced by the same company?
Concept: undefined >> undefined
Direction: Answer the question on the basis of the information given below.
The following information is about the consumption of bread in five towns - A, B, C, D and E. Town A consumes a quarter of the total quantity of bread sold in all the five cities. The bread consumption of Town B is one-fourth of the consumption of Town C. The bread consumption of Town D is 12% of the total whereas Town E consumes 23% of the total.
There are only two companies - Bonbon and Modern - that sell bread in these five towns. The bar graph shows the sales of Bon-bon as a percentage of the total sale of bread in each city.
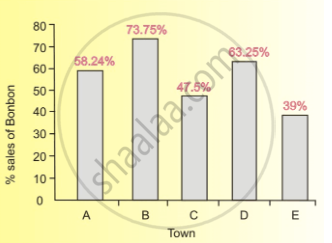
If the total consumption of bread in Town E was 3450 loaves during a particular week, then what was the total consumption of bread in Town A during that week?
Concept: undefined >> undefined
Direction: Answer the question on the basis of the information given below.
The following information is about the consumption of bread in five towns - A, B, C, D and E. Town A consumes a quarter of the total quantity of bread sold in all the five cities. The bread consumption of Town B is one-fourth of the consumption of Town C. The bread consumption of Town D is 12% of the total whereas Town E consumes 23% of the total.
There are only two companies - Bonbon and Modern - that sell bread in these five towns. The bar graph shows the sales of Bon-bon as a percentage of the total sale of bread in each city.
What was the total consumption of Bonbon bread in Towns A and B during a particular week when the total consumption of bread in Town D was 3600 loaves?
Concept: undefined >> undefined
Direction: Answer the question on the basis of the information given below.
The following information is about the consumption of bread in five towns - A, B, C, D and E. Town A consumes a quarter of the total quantity of bread sold in all the five cities. The bread consumption of Town B is one-fourth of the consumption of Town C. The bread consumption of Town D is 12% of the total whereas Town E consumes 23% of the total.
There are only two companies - Bonbon and Modern - that sell bread in these five towns. The bar graph shows the sales of Bon-bon as a percentage of the total sale of bread in each city.
What is the difference in the consumption of Modern bread and Bonbon bread in Town C, if the total consumption of bread in all the five towns was 10000 loaves during a particular week?
Concept: undefined >> undefined
