Advertisements
Advertisements
प्रश्न
Which sample, A or B shown in figure has shorter mean-life?

Advertisements
उत्तर
Mean (or average) life (ґ): The time for which a radioactive material remains active is defined as the mean (average) life of that material.
• It is defined as the sum of lives of all atoms divided by the total number of atoms.
i.e., `r = "Sum of the lives of all the atoms"/"Total number of atoms" = 1/λ`
• From `N = N_0e^(-λt)` ⇒ In `(N/N_0)/t = - λ`, the slope of the line shown in the graph, i.e., the magnitude of the inverse of slope of `N/N_0` vs t curve is known as mean life (τ).

• From `N = N_0e^(-λt)`, if `t = 1/λ = τ`
⇒ `N = N_0e^(-t) = N_0(1/e)` = 0.37 N0
= 37% of N0
i.e., mean life is the time interval in which the number of undecayed atoms (N) becomes `1/e` times or 0.37 times or 37% of the original number of atoms
• It is the time in which the number of decayed atoms (N0 – N) becomes `(1 - 1/e)` times or 0.63 times or 63% of the original number of atoms.
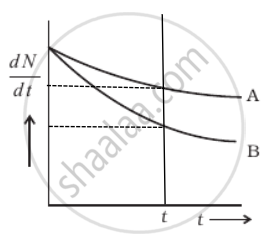
From the given figure, we can say that
At t = 0, `((dN)/(dt))_A = ((dN)/(dt))_B`
As `(dN)/(dt) = - λN`
⇒ (N0)A = (N0)B
Now considering any instant t by drawing a line perpendicular to the time axis, we find that `((dN)/(dt))_A > ((dN)/(dt))_B`
Hence, λANA = λBNB
∴ NA > NB ⇒ λB > λB ......[Rate of decay of B is slower]
But average life `τ = 1/λ` ⇒ τA > τB
