Advertisements
Advertisements
प्रश्न
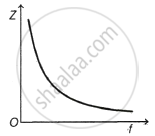
Which of the following graph represents the impedance Z of the L-C-R series resonant combination?
|
(A) |
(B) |
|
(C) |
(D) |


विकल्प
A
B
C
D
MCQ
Advertisements
उत्तर
B
Explanation:
The impedance of the series L-C-R circuit is given by,
Z = `sqrt(R^2 + (X_L - X_C)^2)`
= `sqrt(R^2 + (2pifL - 1/(2pifC))^2)`
The value of the impedance (Z) first decreases with the increase of frequency (f) of the AC source and becomes minimum at the resonance frequency (f = f0) because at the resonance frequency, XL = XC, thus Zmin = R.
Z begins to rise as we raise the AC source's frequency more, f(f > f0). Thus, option b displays the right graph.
shaalaa.com
Types of AC Circuits
क्या इस प्रश्न या उत्तर में कोई त्रुटि है?
