Advertisements
Advertisements
प्रश्न
What determines the slope of the budget line?
Advertisements
उत्तर
Consumer preferences and tastes are shown via indifference curves. To determine the quantities of the two commodities that the household will buy, we also need to know the prices of the two commodities and the amount of money the household wishes to spend on them. We may create a budget line using this information, which includes the pricing and expenditures on two items. The budget line indicates what the household can accomplish, whereas indifference curves indicate the choices the household would prefer to make.
Let us draw a budget line and explain it by taking an example.
Assume that a consumer has ₹200 to spend on food and clothes, with food costing ₹20 per unit and clothing costing ₹40 per unit. Given the consumer's spending and the costs of two goods, how much food and clothing can the consumer purchase? Five pieces of clothing and no meals can be bought if the customer spends the whole ₹200 on clothing. The customer will spend ₹ 160 on clothing if they purchase four units of clothing at a cost of ₹ 40 each, with the remaining ₹ 40 going toward purchasing two units of food. On the other hand, if the customer spends the entire ₹200 on food, they will only be able to purchase 10 units of food and no clothing. The table displays these and a number of additional combinations of food and clothing amounts.
| Units of Clothing | Units of Food | Expenditure |
| 5 | 0 | (5 × 40) + (0 × 20) = ₹ 200 |
| 4 | 2 | (4 × 40) + (2 × 20) = ₹ 200 |
| 3 | 4 | (3 × 40) + (4 × 20) = ₹ 200 |
| 2 | 6 | (2 × 40) + (6 × 20) = ₹ 200 |
| 1 | 8 | (1 × 40) + (8 × 20) = ₹ 200 |
| 0 | 10 | (0 × 40) + (10 × 20) = ₹ 200 |
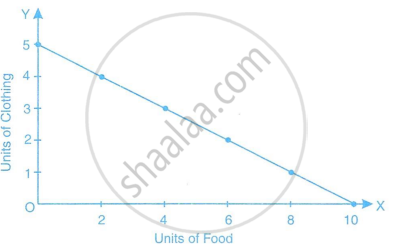
These combinations show the highest quantities that can be bought for ₹200 at the specified food and clothing prices. These pairings can be visually represented in a diagram. We have plotted different combinations of food and clothing from the Table, with the units of food on the horizontal axis and the units of clothing on the vertical axis. A line is then drawn connecting these places. From zero food units and five clothing units in the upper left to ten food units and zero clothing units in the lower right, these points form a downward sloping line. This line displays all other food and clothing combinations listed in the Table, including 4 units of clothes and 2 units of food. This line is called the "price line" or "budget line." It is known as the budget line because it displays different outfit and food combinations that, at the current costs of the two goods, can be bought for about ₹ 200. As a result, a budget line displays different combinations of two commodities that can be bought at specific prices for the two commodities using a particular budget.
