Advertisements
Advertisements
प्रश्न
Using a graph paper, draw an ogive for the following distribution which shows a record of weight in kilograms of 100 students.
| Weight (in kg) | Number of students |
| 35 − 40 | 4 |
| 40 − 45 | 6 |
| 45 − 50 | 10 |
| 50 − 55 | 24 |
| 55 − 60 | 26 |
| 60 − 65 | 17 |
| 65 − 70 | 8 |
| 70 − 75 | 5 |
Use your ogive to estimate the following:
- The median weight of the students.
- Percentage of students whose weight is 60 kg or more.
- The weight above which 20% of the students lie.
Advertisements
उत्तर
The cumulative frequency table for the given continuous distribution is:
| Weight (in kg) | Number of students | Cumulative frequency |
| 35 − 40 | 4 | 4 |
| 40 − 45 | 6 | 10 |
| 45 − 50 | 10 | 20 |
| 50 − 55 | 24 | 44 |
| 55 − 60 | 26 | 70 |
| 60 − 65 | 17 | 87 |
| 65 − 70 | 8 | 95 |
| 70 − 75 | 5 | 100 |
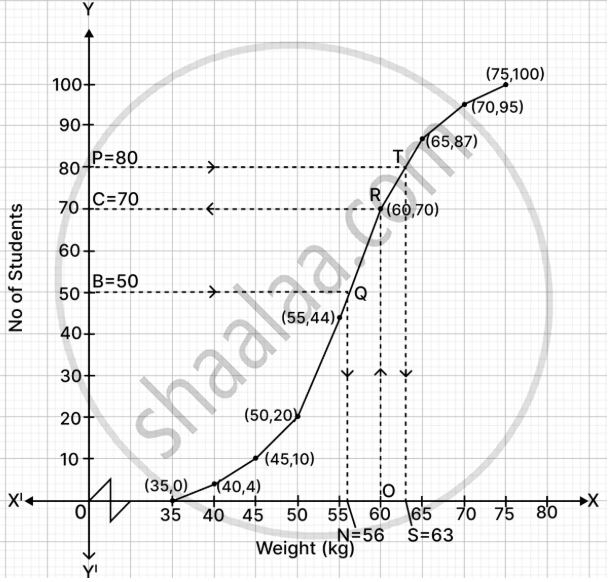
(a) Steps of Construction:
-
Since the x-axis begins at 35, a kink (break) is placed near the origin to show the scale starts at that value rather than zero.
- Using a scale of 1 cm = 5 kg on the x-axis and 1 cm = 10 students on the y-axis.
- Plot the on the x-axis and 1 cm = 10 students on the y-axis, plot the cumulative frequencies against their respective upper class limits: (40, 4), (45, 10), (50, 20), (55, 44), (60, 70), (65, 87), (70, 95), and (75, 100). Additionally, include the lower limit of the initial class (35, 0).
- Join these points by a freehand drawing.
Connect these points with a smooth, freehand curve to create the ogive.
= `n/2`
= `100/2`
= 50
From point B, draw a horizontal line until it intersects the ogive at point Q. From Q, drop a vertical line to meet the x-axis at point N. The abscissa (x-coordinate) of point N represents the median weight of the students.
From the graph, N = 56
Hence, the median weight = 56 kg.
(b) To determine the percentage of students weighing 60 kg or more, identify point O on the x-axis at 60.
From O, draw a vertical line to intersect the ogive at point R. Then, draw a horizontal line from R to the y-axis to locate point C.
The ordinate (y-coordinate) of point C represents the number of students whose weight is less than 60 kg. To find those weighing 60 kg or more, subtract this value from the total number of students.
From the graph,
C = 70
Students weighing more than 60 kg
= 100 − 70
= 30
Percentage of students weighing more than 60 kg
= `30/100 × 100`
= 30%
Hence, students weighing more than 60 kg = 30%.
(c) The weight above which 20% of the students lie.
Total number of students = 100
20% of students = `20/100 × 100`
= 20
So, 80 students are below that weight.
Let P be the point on the y-axis representing the number of students = 80.
From the graph,
S = 63
Hence, the weight above which 20% students lie = 63 kg.
