Advertisements
Advertisements
प्रश्न
The table shows the distribution of the scores obtained by 160 shooters in a shooting competition. Use a graph sheet and draw an ogive for the distribution. (Take 2 cm = 10 scores on the X-axis and 2 cm = 20 shooters on the Y-axis).
| Scores | 0-10 | 10-20 | 20-30 | 30-40 | 40-50 | 50-60 | 60-70 | 70-80 | 80-90 | 90-100 |
| No. of shooters |
9 | 13 | 20 | 26 | 30 | 22 | 15 | 10 | 8 | 7 |
Use your graph to estimate the following:
1) The median
2) The interquartile range.
3) The number of shooters who obtained a score of more than 85%.
Advertisements
उत्तर
| Scores | f | c.f. |
| 0 – 10 | 9 | 9 |
| 10 – 20 | 13 | 22 |
| 20 – 30 | 20 | 42 |
| 30 – 40 | 26 | 68 |
| 40 – 50 | 30 | 98 |
| 50 – 60 | 22 | 120 |
| 60 – 70 | 15 | 135 |
| 70 – 80 | 10 | 145 |
| 80 – 90 | 8 | 153 |
| 90 – 100 | 7 | 160 |
| n = 160 |
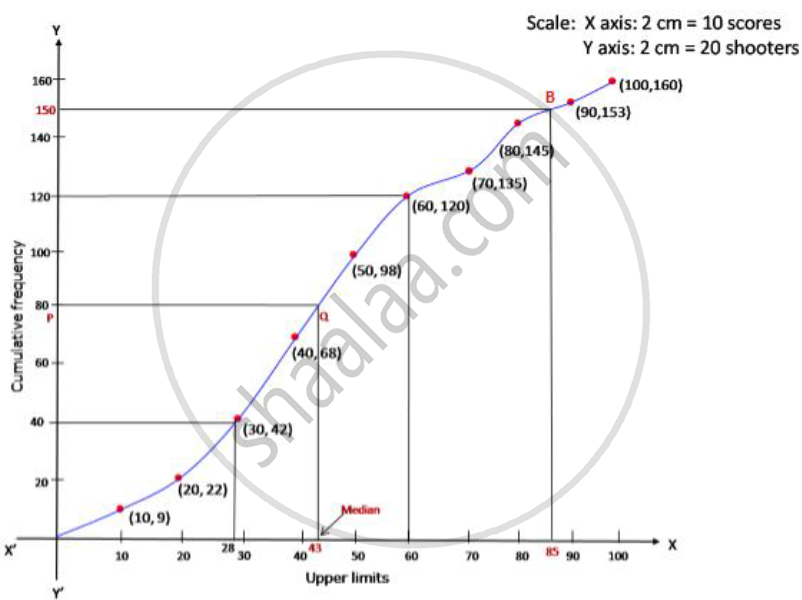
1) Median = `(n/2)^"th" term = (160/2)^"th"` term =80 term.
Through mark 80 on the y-axis, draw a horizontal line which meets the ogive drawn at point Q.
Through Q, draw a vertical line which meets the x-axis at the mark of 43.
⇒ Median = 43
2) Since the number of terms = 160
Lower quartile `(Q_1) = (160/4)^"th" "term" 120^"th" " term" = 60`
∴ Inter-quartile range = `Q_3 - Q_1` = 60 - 28 = 32
3) Since 85% scores = 85% of 100 = 85
Through mark for 85 on x-axis, draw a vertical line which meets the ogive drawn at point B.
Through the point B, draw a horizontal line which meets the y-axis at the mark of 150.
⇒ Number of shooters who obtained more than 85% score=160-150=10
