Advertisements
Advertisements
प्रश्न
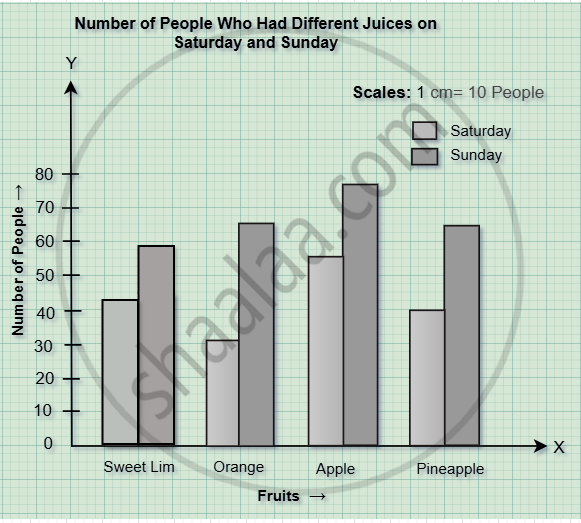
The table below shows the number of people who had different juices at a juice bar on a Saturday and a Sunday. Draw a joint bar graph for this data.
| Days | Fruits | Sweet Lim | Orange | Apple | Pineapple |
| Saturday | 43 | 30 | 56 | 40 | |
| Sunday | 59 | 65 | 78 | 67 | |
आलेख
Advertisements
उत्तर
shaalaa.com
क्या इस प्रश्न या उत्तर में कोई त्रुटि है?
