Advertisements
Advertisements
प्रश्न
The marks obtained by 120 students in a mathematics test is given below:
| Marks | No. of students |
| 0 – 10 | 5 |
| 10 – 20 | 9 |
| 20 – 30 | 16 |
| 30 – 40 | 22 |
| 40 – 50 | 26 |
| 50 – 60 | 18 |
| 60 – 70 | 11 |
| 70 – 80 | 6 |
| 80 – 90 | 4 |
| 90 – 100 | 3 |
Draw an ogive for the given distributions on a graph sheet. Use a suitable scale for your ogive. Use your ogive to estimate:
- the median
- the number of student who obtained more than 75% in test.
- the number of students who did not pass in the test if the pass percentage was 40.
- the lower quartile.
Advertisements
उत्तर
| Marks | No. of students | c.f. |
| 0 – 10 | 5 | 5 |
| 10 – 20 | 9 | 14 |
| 20 – 30 | 16 | 30 |
| 30 – 40 | 22 | 52 |
| 40 – 50 | 26 | 78 |
| 50 – 60 | 18 | 96 |
| 60 – 70 | 11 | 107 |
| 70 – 80 | 6 | 113 |
| 80 – 90 | 4 | 117 |
| 90 – 100 | 3 | 120 |
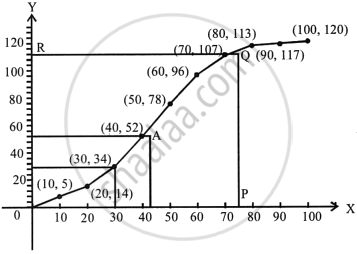
First of all, we plot the points (0, 0), (10, 5), (20, 14), (30, 30), (40, 52), (50, 78), (60, 96), (70, 107), (80, 113), (90, 117), (100, 120) on graph paper and join them by free hand curve to give the required ogive.
Median = `120/2` = 60.5th term.
i. Through 60.5th marks, draw a line segment parallel to x-axis which meets the curve at A.
From A, draw a line segment perpendicular to, x-axis meeting at B.
∴ B is the median = 43 ...(approx.)
ii. On x-axis, a point P representing 75, drawn vertical line meeting ogive at Q. From Q draw a ⊥ on y-axis meeting y-axis at R, the ordinate of y be 110.
No. of students who obtained upto 75% marks in the test = 110
∴ No. of students who obtained more than 75% = 120 – 110 = 10
iii. No. of students who obtained less than 40% marks in the test = 52 ...(∴ in the graph x = 40, y = 52)
iv. The lower quartile = (Q1)
= `120 xx 1/4`
= 30th term
= 30
From a point B (30) on y-axis, draw a parallel to x-axis meeting the curve at Q and from Q. Draw a line parallel to x-axis meeting it at 30.
∴ Lower Quartile = 30 = Q1.
