Advertisements
Advertisements
प्रश्न
The mark of 200 students in a test were recorded as follows:
| Marks % | No. of students |
| 10 - 19 | 7 |
| 20 - 29 | 11 |
| 30 - 39 | 20 |
| 40 - 49 | 46 |
| 50 - 59 | 57 |
| 60 - 69 | 37 |
| 70 - 79 | 15 |
| 80 - 89 | 7 |
Draw the cumulative frequency table.
Draw an ogive and use it to find:
(i) The median
(ii) The number of students who scored more than 35% marks.
Advertisements
उत्तर
The given frequency distribution is discontinuous, to convert it into continuous distribution.
Adjustment factor = `(20 - 19)/(2)` = 0·5.
Cumulative (continuous) frequency tab;e for the given data is :
| Marks % (Classes before adjustment) |
Marks % (Classes after adjustment) |
Frequency | Cumulative frequency |
| 10 - 19 | 9·5 - 19·5 | 7 | 7 |
| 20 - 29 | 19·5 - 29·5 | 11 | 18 |
| 30 - 39 | 29·5 - 39·5 | 20 | 38 |
| 40 - 49 | 39·5 - 49·5 | 46 | 84 |
| 50 - 59 | 49·5 - 59·5 | 57 | 141 |
| 60 - 69 | 59·5 - 69·5 | 37 | 178 |
| 70 - 79 | 69·5 - 79·5 | 15 | 193 |
| 80 - 89 | 79·5 - 89·5 | 7 | 200 |
Take 1 cm along X-axis = 10% marks and 1 cm along Y-axis = 25 students.
Plot the point (19·5, 7), (29·5 - 18), (39·5 - 38), (49·5 - 141), (69·5 - 178), (9·5 - 193), (89·5 - 200) and (9·5 - 0) join these points by a free hand drawing.
The required ogive is drawn in the figure given below: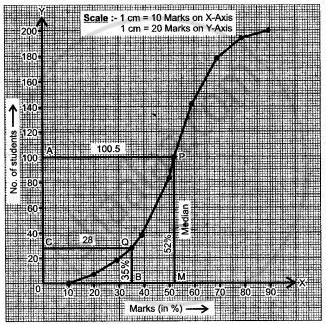
(i) To find the median: Let A be a point on Y-axis representing frequency
= `(1)/(2) [("n"^"th"/2 "term") + ("n"/2 + 1)^"th" "term"]`
= `(1)/(2)(100 + 101)`
= 100·5.
Through A draw a horizontal line to meet the ogive at P. Through P draw a vertical line to meet X-axis at M. the abscissae of point M represents 52%.
∴ The required median = 52%.
(ii) Let the point B on X-axis represent 35% marks. Through B draw a vertical line to meet the ogive at Q. Through Q draw a horizontal line to meet Y-axis at C. The ordinate of the point C represents 28 students on Y-axis.
∴ The number of students who scored more than 35% marks = total no. of students - no. of students who scored ≤35%
= 200 - 8
= 172.
