Advertisements
Advertisements
प्रश्न
The graph given below depicts the results of the study done to assess the implementation of the Right to Education (2009) in government, aided and private unaided schools in four states in India. Study the graph and answer the question that follows:
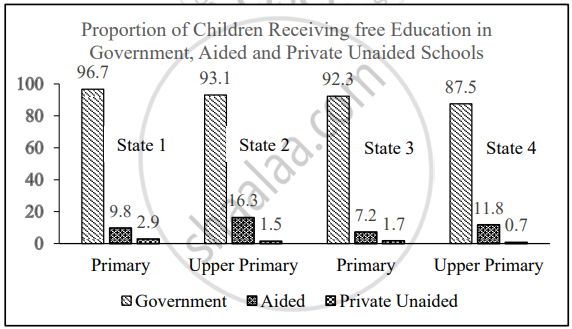
Analyse the effectiveness of Right to Education in addressing the disparity in education.
विस्तार में उत्तर
Advertisements
उत्तर
The RTE Act (2009) mandates that all children aged between 6 and 14 must receive free and compulsory education, ensuring that economic barriers do not prevent children from attending school.
- The graph shows that government schools have admitted a large number of children as per the Act. It shows a successful implementation of the Act uniformly in all the states depicted in the graph.
- However, the same cannot be inferred about aided and private schools. The reasons for this disparity could be multiple.
- A successful implementation of this act requires trained and sensitive teachers who can induct these children smoothly into the mainstream and ensure learning.
- The class and culture divide between rich and poor is so wide that at times children from underprivileged sections either do not seek admissions in private/aided schools or they are not admitted by the schools.
- At times, the lack of an inclusive and supportive learning environment in private schools results in a low admission rate.
- Also, the lack of awareness among parents about RTE limits them to enrolling their children in government schools.
shaalaa.com
क्या इस प्रश्न या उत्तर में कोई त्रुटि है?
