Advertisements
Advertisements
प्रश्न
The following observed values of x and y are thought to satisfy a linear equation. Write the linear equation:
| x | 6 | – 6 |
| y | –2 | 6 |
Draw the graph using the values of x, y as given in the above table. At what points the graph of the linear equation
- cuts the x-axis
- cuts the y-axis
Advertisements
उत्तर
Given, points are (6, –2) and (–6, 6).
Let the linear equation y = mx + c is satisfied by the points (6, –2) and (–6, 6), then at point (6, –2)
–2 = 6m + c ...(i)
And at point (–6, 6), 6 = –6m + c ...(ii)
On subtracting equation (ii) from equation (i), we get
12m = –8
⇒ `m = (-8)/12`
⇒ `m = -2/3`
On putting the value of m in equation (i), we get
`–2 = 6(-2/3) + c`
–2 = –4 + c
⇒ c = –2 + 4
⇒ c = 2
On putting m = `-2/3` and c = 2 in linear equation y = mx + c, we get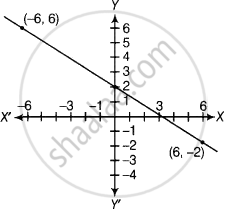
`y = -2/3x + 2`
⇒ `y = (-2x + 6)/3`
⇒ 3y = –2x + 6
⇒ 3y + 2x = 6
When the graph of the linear equation
i. Cuts the x-axis
Then, put y = 0 in equation 2x + 3y = 6, we get
⇒ 2x + 3·0 = 6
⇒ 2x = 6
∴ x = 3
When the graph of the linear equation
ii. Cuts the y-axis
Then, put y = 0 in equation 2x + 3y = 6, we get
⇒ 2·0 + 3y = 6
⇒ 3y = 6
∴ y = 2
Therefore, the graph the linear equation cuts the x-axis at the point (3, 0) and the y-axis at the point (0, 2).
