Advertisements
Advertisements
प्रश्न
The following diagram represents the population growth curves of two different species, A and B, living together in an area. Answer the following questions based on it.
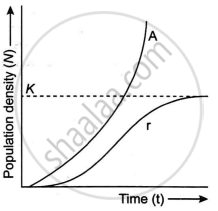
- What type of growth patterns are exhibited by species A and B?
- Give mathematically equations to represent the growth curves of species A and species B separately.
- In the diagram, what does the horizontal line K represent?
अति संक्षिप्त उत्तर
Advertisements
उत्तर
i. Species A = Exponential growth, Species B = Logistic growth
ii. A = `(dN)/(dt) = rN`, B = `(dN)/(dt) = rN((K - N)/K)`
iii. K represents carrying capacity.
shaalaa.com
क्या इस प्रश्न या उत्तर में कोई त्रुटि है?
