Advertisements
Advertisements
प्रश्न
The following data represents the daily wages in rupees of a certain number of employees of a company:
| Daily wages (in ₹) | No. of Employees |
| 30 – 40 | 8 |
| 40 – 50 | 14 |
| 50 – 60 | 12 |
| 60 – 70 | 17 |
| 70 – 80 | 20 |
| 80 – 90 | 26 |
| 90 – 100 | 13 |
| 100 – 110 | 10 |
Use a graph to answer the following questions:
- Represent the above distribution by an ogive.
- Find the following on the graph drawn:
- median wage.
- percentage of employees who earn more than ₹ 84 per day.
- number of employees who earn ₹ 56 and below.
Advertisements
उत्तर
Cumulative frequency distribution table:
| Daily wages (in ₹) | No. of employees | Cumulative frequency |
| 30 – 40 | 8 | 8 |
| 40 – 50 | 14 | 22 |
| 50 – 60 | 12 | 34 |
| 60 – 70 | 17 | 51 |
| 70 – 80 | 20 | 71 |
| 80 – 90 | 26 | 97 |
| 90 – 100 | 13 | 110 |
| 100 – 110 | 10 | 120 |
Here, n = 120, which is even.
Median = `n/2`
= `120/2`
= 60th term
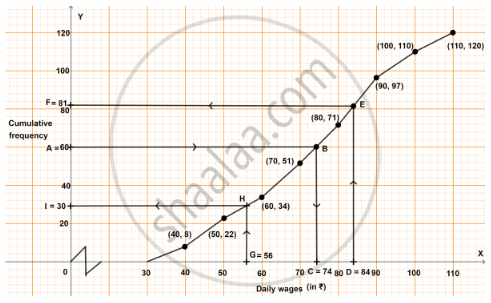
Steps of construction:
1. Plot daily wages on x-axis.
2. Plot cumulative frequency on y-axis.
3. Mark points (40, 8), (50, 22), (60, 34), (70, 51), (80, 71), (90, 97), (100, 110) and (110, 120).
4. Draw a free hand curve passing through the points marked, strating from the lower limit of first class and terminating at upper limit of the last class.
5. Mark A = 60 on y-axis, draw a horizontal line which meets curve at B.
6. Through point B, draw a vertical line which meets x-axis at point C. The value of point C on x-axis is the median.
∴ Median wage is ₹ 74.
7. Mark D = 84 on x-axis, draw a vertical line which meets curve at E.
8. Through point E, draw a horizontal line which meets y-axis at point F. The value of point F on y-axis represents no. of employees earning less than or equal to ₹ 84 per day.
From graph,
F = 81.
No. of employees earning more than ₹ 84 per day
= 120 – 81
= 39
Percentage of employees earning more than ₹ 84
= `("No. of employees earining more than" ₹ 84)/"Total employees" xx 100`
= `39/120 xx 100`
= `3900/120`
= 32.5%
9. Mark G = 56 on x-axis, draw a vertical line which meets curve at H.
10. Through point H, draw a horizontal line which meets y-axis at point I. The value of point I on y-axis represents no. of employees earning less than or equal to ₹ 56 per day.
From graph,
I = 30.
No. of employees earning less than or equal to ₹ 56 per day = 30.
