हिंदी

Show with the help of a diagram the effect on equilibrium price and quantity when there is a rise in the prices of inputs. - Economics

Advertisements
Advertisements

प्रश्न

Show with the help of a diagram the effect on equilibrium price and quantity when there is a rise in the prices of inputs.

आकृति
विस्तार में उत्तर
Advertisements

उत्तर

A rise in input prices (such as wages, raw materials, etc.) increases the cost of production for producers. As a result, firms supply less at each price level, leading to a leftward shift of the supply curve, while the demand remains unchanged. 

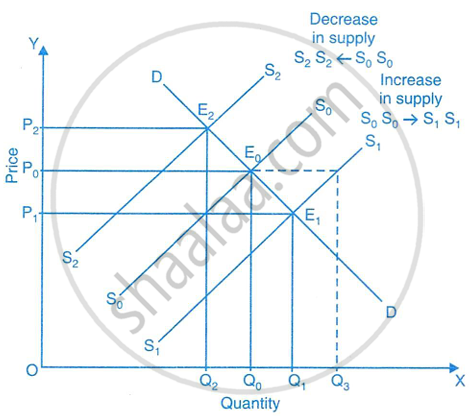
The diagram shows how equilibrium price and quantity are affected when supply changes and demand remains constant. Initially, supply curve S0 and demand curve D intersect at point E0, giving equilibrium price OP and quantity OQ1. When supply increases (shift to S1), the new equilibrium is at E1, where price falls to OP1 and quantity rises to OQ3. When supply decreases (shift to S2), equilibrium moves to E2, where price rises to OP2 and quantity falls to OQ2.

shaalaa.com
Market Equilibrium
  क्या इस प्रश्न या उत्तर में कोई त्रुटि है?
अध्याय 6: Market Mechanism: Equilibrium Price and Quantity in a Competitive Market - TEST YOURSELF QUESTIONS [पृष्ठ ११४]

APPEARS IN

फ्रैंक Economics [English] Class 12 ISC
अध्याय 6 Market Mechanism: Equilibrium Price and Quantity in a Competitive Market
TEST YOURSELF QUESTIONS | Q 15. (ii) | पृष्ठ ११४
आर. के. लेखी और पी. के. धर Economics [English] Class 12 ISC
अध्याय 12 Producer's Equilibrium Under Perfect Competition
EXAMINATION CORNER | Q 10. (ii) | पृष्ठ १२.१०
फ्रैंक Economics [English] Class 12 ISC
अध्याय 6 Market Mechanism: Equilibrium Price and Quantity in a Competitive Market
TEST YOURSELF QUESTIONS | Q 15. (ii) | पृष्ठ ११६
Share
Notifications

Englishहिंदीमराठी


      Forgot password?
Use app×