Advertisements
Advertisements
प्रश्न
How does a graph help in determining the proportional relationship between the two quantities?
Advertisements
उत्तर
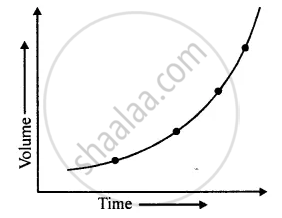
It has been found that if a graph is plotted between the pressure of an enclosed gas at a constant temperature, against its volume, the graph line is a smooth curve, which does not meet X-axis or Y-axis on extending as shown in the figure.
From the figure, it is clear that the pressure of a gas is not directly proportional to the volume of gas.

However, if a graph is plotted between pressure and the inverse of volume, the graph line is a straight line as illustrated in the figure. From the straight-line graph we can say:
The pressure is inversely proportional to volume.
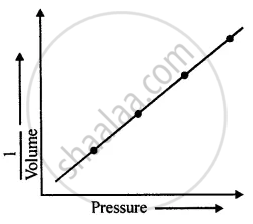
Thus, P α `1/"V"`
Similarly, if a graph is plotted between length and time period of a simple pendulum, the graph line is a curve, which has a tendency to meet X-axis or Y-axis when produced towards the origin, as shown in the figure.
From the figure, it is clear that the length of a simple pendulum is not proportional to its time period.
However, if a graph is plotted between length and (Time)2, the graph line is a straight line. Thus, we can say:
From the above discussion, it is very clear that the graph line helps to determine the nature of proportional relationship between two variable quantities.
