Advertisements
Advertisements
प्रश्न
Find the correlation between land under permanent crops and GDP given in the table using Spearman’s Rank Correlation. Write the conclusion in your own words:

Advertisements
उत्तर
| X1 | R1 | Y1 | R2 | R1 − R2 | (R1 − R2)2 | |
| A | 0.3 | 11 | 76.48 | 12 | −1 | 1 |
| B | 0.04 | 12 | 1364.83 | 7 | 5 | 25 |
| C | 16.0 | 1.0 | 837.58 | 8 | −7 | 49 |
| D | 0.8 | 7.5 | 567.48 | 9 | −1.5 | 2.25 |
| E | 1.0 | 5.5 | 3456.35 | 4 | 1.5 | 2.25 |
| F | 0.6 | 9.0 | 312.84 | 10 | −1 | 1 |
| G | 1.0 | 5.5 | 1391.25 | 6 | −0.5 | 0.25 |
| H | 1.8 | 4.0 | 3061.14 | 5 | −1 | 1 |
| I | 4.1 | 3.0 | 11325.66 | 1 | 2 | 4 |
| J | 13.0 | 2.0 | 3737.48 | 3 | −1 | 1 |
| K | 0.8 | 7.5 | 5747.49 | 2 | 5.5 | 30.25 |
| L | 0.5 | 10 | 206.22 | 11 | −1 | 1 |
| ∑ = 118 |
X<sub>1</sub> = Land under permanent crops
Y<sub>1</sub> = GDP
R<sub>1</sub> = Rank – 1, R<sub>2</sub> = Rank – 2, n = 12 (No. of pairs)
Rank correlation R = `1 – (6sum(R_1 - R_2)^2) / (n(n^2-1))`
`=1 -( 6xx118)/(12(144-1))`
`= 1- 108/1716`
= 1 – 0.412
= 0.588
= 0.59
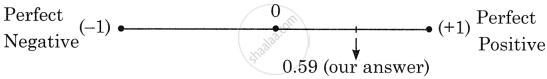
The correlation between (1) land under permanent crops and (2) GDP is +0.59, indicating a positive relationship between the two variables.
This value does not represent a perfect positive correlation (+1.0) but is somewhat lower, i.e., +0.59.
This suggests that as the area of land under permanent crops increases, GDP also tends to increase, and similarly, a decrease in cropland is generally associated with a lower GDP.
The reason for this is that agricultural production contributes to GDP growth.
However, since the correlation is only 0.59, it implies that this relationship does not apply universally across all countries, as other sectors, factors, and industries also play a significant role in contributing to GDP besides agriculture.
