Advertisements
Advertisements
प्रश्न
Explain the relationship between marginal revenue and total revenue with the help of a revenue schedule.
Compare the relationship between average and marginal revenues of a firm under perfect competition and imperfect competition.
Show marginal revenue's relationship with average revenue.
Using diagrams, distinguish between the shapes of the total revenue, marginal revenue and average revenue curve under perfect and imperfect competition.
Advertisements
उत्तर
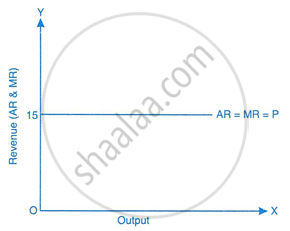
Under Perfect Competition
- Price remains constant at all levels of output.
- Firm is a price taker.
| Units Sold (Q) | Price (₹) | Total Revenue (TR = P × Q) | Marginal Revenue (MR = ΔTR) |
| 1 | 15 | 15 | 15 |
| 2 | 15 | 30 | 15 |
| 3 | 15 | 45 | 15 |
| 4 | 15 | 60 | 15 |
| 5 | 15 | 75 | 15 |
As each unit is sold at the same price (₹ 15), total revenue increases at a constant rate. Marginal revenue is constant and equal to price. MR = AR = Price under perfect competition.
Graphically:
 |
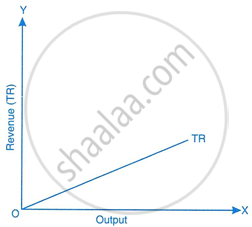 |
Under Imperfect Competition:
- Firm has some control over price.
- To sell more units, it must lower the price.
- Price decreases with increase in output.
| Units Sold (Q) | Price (₹) | Total Revenue (TR = P × Q) | Marginal Revenue (MR = ΔTR) |
| 1 | 20 | 20 | 20 |
| 2 | 18 | 36 | 16 |
| 3 | 16 | 48 | 12 |
| 4 | 14 | 56 | 8 |
| 5 | 12 | 60 | 4 |
| 6 | 10 | 60 | 0 |
| 7 | 8 | 56 | −4 |
As more units are sold, the firm reduces the price. TR increases at a diminishing rate and then starts falling. MR keeps falling, becomes zero, and then negative. MR < AR at all levels under imperfect competition.
Graphically:

Notes
Students can refer to the answer according to their question.
