Advertisements
Advertisements
प्रश्न
Explain the law of variable proportions with the help of a diagram.
Explain the law of variable proportions.
Advertisements
उत्तर
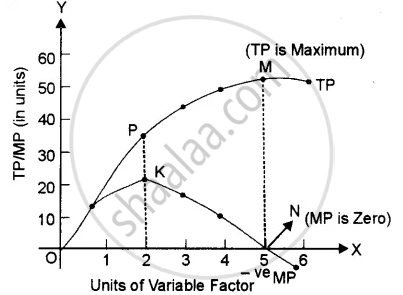
The law of variable proportions (LVP) states that as we increase the quantity of only one input, keeping other inputs fixed, total product (TP) initially increases at an increasing rate, then at a decreasing rate and finally at a negative rate.
In the given diagram, the quantity of the variable factor has been measured on X-axis and the Y-axis measures the total product on the Y-axis. The diagram indicates how the total product and marginal product change as a result of increases in the quantity of one factor to a fixed quantity of other factors.
The law can be better explained through three stages:
- First stage:
- Increasing return to a factor: In the first stage, every additional variable factor adds more and more to the total output. It means TP increases at an increasing rate and the MP of each variable factor rises. Better utilisation of fixed factors and increases in the efficiency of a variable factor due to specialisation are the major factors responsible for increasing returns. The increasing returns to a factor stage have been shown in the given diagram between O to P. It implies. TP increases at an increasing rate (till point ‘P’) and MP rises till it reaches its maximum point ‘K,’ which marks the end of the first phase.
- Increasing return to a factor: In the first stage, every additional variable factor adds more and more to the total output. It means TP increases at an increasing rate and the MP of each variable factor rises. Better utilisation of fixed factors and increases in the efficiency of a variable factor due to specialisation are the major factors responsible for increasing returns. The increasing returns to a factor stage have been shown in the given diagram between O to P. It implies. TP increases at an increasing rate (till point ‘P’) and MP rises till it reaches its maximum point ‘K,’ which marks the end of the first phase.
- Second stage:
- Diminishing returns to a Factor: In the second stage, every additional variable factor adds a lesser and lesser amount of output. It means TP increases at a diminishing rate and MP falls with an increase in a variable factor. The breaking of the optimum combination of a fixed and variable factor is the major factor responsible for diminishing returns. The second stage ends at point ‘S’ when MP is zero and TP is maximum (point ‘M’).
Stage 2 is very crucial, as a rational producer will always aim to produce in this phase because TP is maximum and MP of each variable factor is positive.
- Diminishing returns to a Factor: In the second stage, every additional variable factor adds a lesser and lesser amount of output. It means TP increases at a diminishing rate and MP falls with an increase in a variable factor. The breaking of the optimum combination of a fixed and variable factor is the major factor responsible for diminishing returns. The second stage ends at point ‘S’ when MP is zero and TP is maximum (point ‘M’).
- Third stage:
- Negative Returns to a Factor: In the third stage the employment of additional variable factors causes TP to decline. MP now becomes negative. Therefore, this stage is known as negative returns to a factor. Poor coordination between variable and fixed factors is the basic cause for this stage. In the fig., the third stage starts after point ‘N’ on the MP curve and point ‘O’ on the TP curve. The MP of each variable factor is negative in the 3 stages. So, no firm would deliberately choose to operate in this stage.
Notes
Students should refer to the answer according to their question and preferred marks.
APPEARS IN
संबंधित प्रश्न
State the different phases of change in the total product according to the Law of Variable Proportions. Use diagram
What are the different phases in the Law of Variable Proportions in terms of Total Product ? Give reasons behind each phase. Use diagram.
The short-run production is studied through
Mention the economies reaped from inside the firm
Product obtained from additional factors of production is termed as
Modern economists have propounded the law of
Bring out the Relationship among Total, Average and Marginal Products.
Which one of the following is NOT a ceteris paribus assumption of the Law of Supply?
When the Marginal Product turns negative, Total Product will ______.
Why is the AVC curve U-shaped?
At the point of inflexion, ______ is maximum.
With the help of a diagram, explain the relationship between Average Product and Total Product under the Law of Variable Proportions.
What are Average product?
With the help of a suitable diagram, discuss the relationship between Average product and Marginal Product.
Which term describes the extra output from adding one more unit of labour in production?
What happens to marginal product after a certain point, if more and more labour is added to fixed land?
What is the formula for calculating Average Product?
Why should businesses study the law of variable proportions?
