Advertisements
Advertisements
Direction: Answer the question on the basis of the information given below.
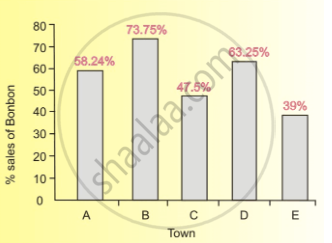
The following information is about the consumption of bread in five towns - A, B, C, D and E. Town A consumes a quarter of the total quantity of bread sold in all the five cities. The bread consumption of Town B is one-fourth of the consumption of Town C. The bread consumption of Town D is 12% of the total whereas Town E consumes 23% of the total.
There are only two companies - Bonbon and Modern - that sell bread in these five towns. The bar graph shows the sales of Bon-bon as a percentage of the total sale of bread in each city.
If the total consumption of bread in Town E was 3450 loaves during a particular week, then what was the total consumption of bread in Town A during that week?
Concept: undefined >> undefined
Direction: Answer the question on the basis of the information given below.
The following information is about the consumption of bread in five towns - A, B, C, D and E. Town A consumes a quarter of the total quantity of bread sold in all the five cities. The bread consumption of Town B is one-fourth of the consumption of Town C. The bread consumption of Town D is 12% of the total whereas Town E consumes 23% of the total.
There are only two companies - Bonbon and Modern - that sell bread in these five towns. The bar graph shows the sales of Bon-bon as a percentage of the total sale of bread in each city.
What was the total consumption of Bonbon bread in Towns A and B during a particular week when the total consumption of bread in Town D was 3600 loaves?
Concept: undefined >> undefined
Advertisements
Direction: Answer the question on the basis of the information given below.
The following information is about the consumption of bread in five towns - A, B, C, D and E. Town A consumes a quarter of the total quantity of bread sold in all the five cities. The bread consumption of Town B is one-fourth of the consumption of Town C. The bread consumption of Town D is 12% of the total whereas Town E consumes 23% of the total.
There are only two companies - Bonbon and Modern - that sell bread in these five towns. The bar graph shows the sales of Bon-bon as a percentage of the total sale of bread in each city.
What is the difference in the consumption of Modern bread and Bonbon bread in Town C, if the total consumption of bread in all the five towns was 10000 loaves during a particular week?
Concept: undefined >> undefined
Direction: Answer the question on the basis of the information given below.
The following information is about the consumption of bread in five towns - A, B, C, D and E. Town A consumes a quarter of the total quantity of bread sold in all the five cities. The bread consumption of Town B is one-fourth of the consumption of Town C. The bread consumption of Town D is 12% of the total whereas Town E consumes 23% of the total.
There are only two companies - Bonbon and Modern - that sell bread in these five towns. The bar graph shows the sales of Bon-bon as a percentage of the total sale of bread in each city.
If the total consumption of Modern bread in Town B is 2100 loaves, then find the total consumption of bread in all the five cities.
Concept: undefined >> undefined
Answer the question based on the information given in the following table. A, B, C, D, E denote companies and 2006, 2007, 2008. 2009& 2010 denote years.
| A | B | C | D | E | ||||||
| M | S | M | S | M | S | M | S | M | S | |
| 2006 | 2.8 | 1.3 | 3.3 | 2.2 | 2.6 | 1.7 | 3.0 | 2.2 | 1.9 | 1.4 |
| 2007 | 3.2 | 2.0 | 2.4 | 1.6 | 2.2 | 1.5 | 2.5 | 1.9 | 2.0 | 1.7 |
| 2008 | 1.9 | 0.9 | 2.9 | 1.6 | 2.1 | 1.0 | 2.3 | 1.5 | 1.6 | 1.1 |
| 2009 | 1.0 | 0.4 | 2.4 | 1.3 | 2.8 | 1.4 | 2.1 | 1.2 | 3.2 | 2.5 |
| 2010 | 2.5 | 1.5 | 2.3 | 1.2 | 2.6 | 2.1 | 1.8 | 1.1 | 3.1 | 2.6 |
What is the total number of units manufactured by company C over me years together?
Concept: undefined >> undefined
Answer the question based on the information given in the following table. A, B, C, D, E denote companies and 2006, 2007, 2008. 2009& 2010 denote years.
| A | B | C | D | E | ||||||
| M | S | M | S | M | S | M | S | M | S | |
| 2006 | 2.8 | 1.3 | 3.3 | 2.2 | 2.6 | 1.7 | 3.0 | 2.2 | 1.9 | 1.4 |
| 2007 | 3.2 | 2.0 | 2.4 | 1.6 | 2.2 | 1.5 | 2.5 | 1.9 | 2.0 | 1.7 |
| 2008 | 1.9 | 0.9 | 2.9 | 1.6 | 2.1 | 1.0 | 2.3 | 1.5 | 1.6 | 1.1 |
| 2009 | 1.0 | 0.4 | 2.4 | 1.3 | 2.8 | 1.4 | 2.1 | 1.2 | 3.2 | 2.5 |
| 2010 | 2.5 | 1.5 | 2.3 | 1.2 | 2.6 | 2.1 | 1.8 | 1.1 | 3.1 | 2.6 |
What is the approximate percent increase in the number of units sold by Company E in the year 2007 from the previous year?
Concept: undefined >> undefined
Answer the question based on the information given in the following table. A, B, C, D, E denote companies and 2006, 2007, 2008. 2009& 2010 denote years.
| A | B | C | D | E | ||||||
| M | S | M | S | M | S | M | S | M | S | |
| 2006 | 2.8 | 1.3 | 3.3 | 2.2 | 2.6 | 1.7 | 3.0 | 2.2 | 1.9 | 1.4 |
| 2007 | 3.2 | 2.0 | 2.4 | 1.6 | 2.2 | 1.5 | 2.5 | 1.9 | 2.0 | 1.7 |
| 2008 | 1.9 | 0.9 | 2.9 | 1.6 | 2.1 | 1.0 | 2.3 | 1.5 | 1.6 | 1.1 |
| 2009 | 1.0 | 0.4 | 2.4 | 1.3 | 2.8 | 1.4 | 2.1 | 1.2 | 3.2 | 2.5 |
| 2010 | 2.5 | 1.5 | 2.3 | 1.2 | 2.6 | 2.1 | 1.8 | 1.1 | 3.1 | 2.6 |
The number of units sold by Company D in the year 2006 is what percent of the number of units manufactured by it in that year? (rounded off to two digits after decimal)
Concept: undefined >> undefined
Answer the question based on the information given in the following table. A, B, C, D, E denote companies and 2006, 2007, 2008. 2009& 2010 denote years.
| A | B | C | D | E | ||||||
| M | S | M | S | M | S | M | S | M | S | |
| 2006 | 2.8 | 1.3 | 3.3 | 2.2 | 2.6 | 1.7 | 3.0 | 2.2 | 1.9 | 1.4 |
| 2007 | 3.2 | 2.0 | 2.4 | 1.6 | 2.2 | 1.5 | 2.5 | 1.9 | 2.0 | 1.7 |
| 2008 | 1.9 | 0.9 | 2.9 | 1.6 | 2.1 | 1.0 | 2.3 | 1.5 | 1.6 | 1.1 |
| 2009 | 1.0 | 0.4 | 2.4 | 1.3 | 2.8 | 1.4 | 2.1 | 1.2 | 3.2 | 2.5 |
| 2010 | 2.5 | 1.5 | 2.3 | 1.2 | 2.6 | 2.1 | 1.8 | 1.1 | 3.1 | 2.6 |
What is the respective ratio of total number of units manufactured by Company A and B together in the year 2009 to those sold by them 1n the same year?
Concept: undefined >> undefined
Answer the question based on the information given in the following table. A, B, C, D, E denote companies and 2006, 2007, 2008. 2009& 2010 denote years.
| A | B | C | D | E | ||||||
| M | S | M | S | M | S | M | S | M | S | |
| 2006 | 2.8 | 1.3 | 3.3 | 2.2 | 2.6 | 1.7 | 3.0 | 2.2 | 1.9 | 1.4 |
| 2007 | 3.2 | 2.0 | 2.4 | 1.6 | 2.2 | 1.5 | 2.5 | 1.9 | 2.0 | 1.7 |
| 2008 | 1.9 | 0.9 | 2.9 | 1.6 | 2.1 | 1.0 | 2.3 | 1.5 | 1.6 | 1.1 |
| 2009 | 1.0 | 0.4 | 2.4 | 1.3 | 2.8 | 1.4 | 2.1 | 1.2 | 3.2 | 2.5 |
| 2010 | 2.5 | 1.5 | 2.3 | 1.2 | 2.6 | 2.1 | 1.8 | 1.1 | 3.1 | 2.6 |
What is the average number of units sold by company D over all the years together?
Concept: undefined >> undefined
The pie chart below shows the Indian Government’s interim budget allocation for the year 2019-2020 in percentage terms. All the questions below should be answered solely based on the pie chart below.

If the Government’s budgetary allocation for ‘Pension’ is Rs. 1.7 lakh crore, which of the following is the closest approximation of the total budget amount of the Government?
Concept: undefined >> undefined
The pie chart below shows the Indian Government’s interim budget allocation for the year 2019-2020 in percentage terms. All the questions below should be answered solely based on the pie chart below.
What percentage of the total budget has been earmarked for ‘Agriculture and Allied Activities’, ‘Subsidy-Fertilizer’ and ‘Subsidy-Food’, collectively?
Concept: undefined >> undefined
The pie chart below shows the Indian Government’s interim budget allocation for the year 2019-2020 in percentage terms. All the questions below should be answered solely based on the pie chart below.
If the entire portion of the budget earmarked for Defence is split equally between ‘Transport’ and ‘Home Affairs’, what would be the new allocations for ‘Transport’ and ‘Home Affairs’ in percentage terms?
Concept: undefined >> undefined
The pie chart below shows the Indian Government’s interim budget allocation for the year 2019-2020 in percentage terms. All the questions below should be answered solely based on the pie chart below.
What percentage (approximately) of the budgetary allocation for ‘Transfer to States’ is the budgetary allocation for ‘Pension’?
Concept: undefined >> undefined
The ratio of two numbers is 4:5. But, if each number is increased by 20, the ratio becomes 6:7. The sum of such numbers is:
Concept: undefined >> undefined
During the academic session 2009-10, in Banaras Hindu University, Varanasi, the number of students studying Arts, Law and Commerce was in the ratio of 5:6:7. If during the academic session 2010-11 the number of students studying Arts, Law and Commerce increased by 20%, 30%, and 40% respectively, what will be the new ratio?
Concept: undefined >> undefined
Direction : Answer the question on the basis of the information given below.
After their wedding, Riz and Rekha decide to move into a new apartment, which is unfurnished. So they decide to buy the necessary home appliances with the gift money that they received at their wedding. The total gift money received was Rs.1,23,000 out of which the amount spent on wooden furniture is Rs.24,000, which is double the amount spent on carpeting the drawing room floor. The remaining amount was spent on buying exactly three items namely TV, AC and Washing Machine, the prices of which are in the ratio 11 : 13: 5 respectively.
Which of the options below states the correct amounts paid by Riz and Rekha to buy their TV, AC and Washing Machine respectively?
Concept: undefined >> undefined
Direction: Answer the question on the basis of the information given below.
After their wedding, Riz and Rekha decide to move into a new apartment, which is unfurnished. So they decide to buy the necessary home appliances with the gift money that they received at their wedding. The total gift money received was Rs.1,23,000 out of which the amount spent on wooden furniture is Rs.24,000, which is double the amount spent on carpeting the drawing room floor. The remaining amount was spent on buying exactly three items namely TV, AC and Washing Machine, the prices of which are in the ratio 11 : 13: 5 respectively.
What percentage (approximately) of the total gift money received by Riz and Rekha was spent on buying the TV and AC?
Concept: undefined >> undefined
Direction: Answer the question on the basis of the information given below.
After their wedding, Riz and Rekha decide to move into a new apartment, which is unfurnished. So they decide to buy the necessary home appliances with the gift money that they received at their wedding. The total gift money received was Rs.1,23,000 out of which the amount spent on wooden furniture is Rs.24,000, which is double the amount spent on carpeting the drawing room floor. The remaining amount was spent on buying exactly three items namely TV, AC and Washing Machine, the prices of which are in the ratio 11 : 13: 5 respectively.
If the cost of carpeting the floor is Rs.30 per square feet, then which of the following can represent the length and breadth of the drawing room of Riz and Rekha's apartment?
Concept: undefined >> undefined
A grocer mixes coffee powder of 2 types, one of which is priced at Rs. 60 and the other at Rs. 90. What should be the ratio of combining the two, to sell the blended mix coffee powder of the two types at Rs. 80?
Concept: undefined >> undefined
When-all the students in a school are made to stand in rows of 54, 30 such rows are formed. If the students are made to stand in rows of 45, how many such rows will be formed?
Concept: undefined >> undefined
